TC Gan, Director, Pre-Sales APAC, Tableau, in an interview with Techseen, talks about the new features in v10 and how visualization impacts data analytics. But before the interview, let’s do a quick recap on the features in Tableau 10.
Tableau 10 has a host of new analytics capabilities that make complex analysis more accessible. Drag and drop clustering automatically identifies patterns and group your data based on k-means. The new Custom territories feature allows you to do advanced geographic analysis with a few clicks. The data highlighter makes it easy to call particular insight while keeping the rest of the data visible for context. Improvements to bar charts, maps data, geographic roles and radial distance units make data storytelling more natural and intuitive.
Also, features, such as cross-database join, help people bring together disparate data sources at the row level without the need to start up complicated integration projects. Cross-database filtering now allows a single filter to be applied to multiple data sources in your workbooks, saving time and getting to the answers faster.
Excerpts of the interview:

How different is Tableau 10 from its already existing features?
TC Gan: Tableau 10 is faster, easier, and more delightful. The new version has at least 30 new features, requested by our community, that continue to make it easier and faster for people to work with data. Additionally, Tableau 10 features a completely refreshed design, new analytical and mobile enhancements, more options for preparing data, and a host of new enterprise capabilities.
The new design makes data the central feature. Data integration helps maximize time spent on analysis. Data analytics innovations like the drag and drop clusters, help people do more advanced analysis of their data without needing to program.
Tableau 10 enables designing, customizing, and publishing a single dashboard with optimized views for any mobile device. And enterprise advancements continue to up the standard for delivering a governed, trusted self-service environment.
How do you see the new features helping with enterprise data management?
TC Gan: There are several large organizations, in data-rich industries like healthcare, banking, technology, and education, that deploy Tableau on a massive scale. With Tableau 10, self-service analytics is taken to a whole new level for enterprises. For instance, there are now easier ways for Tableau Server admins to configure and manage deployments, it is easier than ever to manage and have visibility into the usage of Tableau Desktop licenses, and users can now control the login experience with site-specific SAML IdP configuration.
Also, considering the various data sources that organizations have, Tableau 10 makes prepping and integrating data easier, with connectors like Google Sheets, Quickbooks Online, Kognito, and others. Additionally, features such as cross-database join and union help bring together disparate data sources without the need to start up complicated integration projects. Cross-database filtering now allows a single filter to be applied to multiple data sources in our workbooks.
For developers, new APIs such as JavaScript and REST have been added to Tableau so that will enable them to write custom applications that leverage data or to embed business intelligence into virtually any app or website.
Tableau is now more equipped than ever for enterprise-scale deployments and is being used in some of the biggest companies in the world.
How important is visualization in data analytics?
TC Gan: Humans are visual, cognitive creatures. As such, every element of design and visual analytics was reconsidered in order to maximize cognition and ease of use.
When it comes to design, the new color palette has been tuned up to ensure there is perceptual equality in complex visualization with multiple categories. The typeface – designed by the renowned topography designer Tobias Frere-Jones – was designed for familiarity and clarity. And new default settings help users use visual design best practices for every question, but always give the option to change format so users have the flexibility to be creative and expressive with their data.
With a fresh look and feel, beautiful viz defaults, and new formatting control, the Tableau 10 vizzes are even more impactful for deriving at insights and answers.
Moreover, the new visual analytics capabilities make it easier to communicate with data. Clustering now helps users to identify patterns and group data better, custom territories allow a deeper understanding of maps, and the data highlighter helps call out certain insights while keeping the rest of the data available as context.
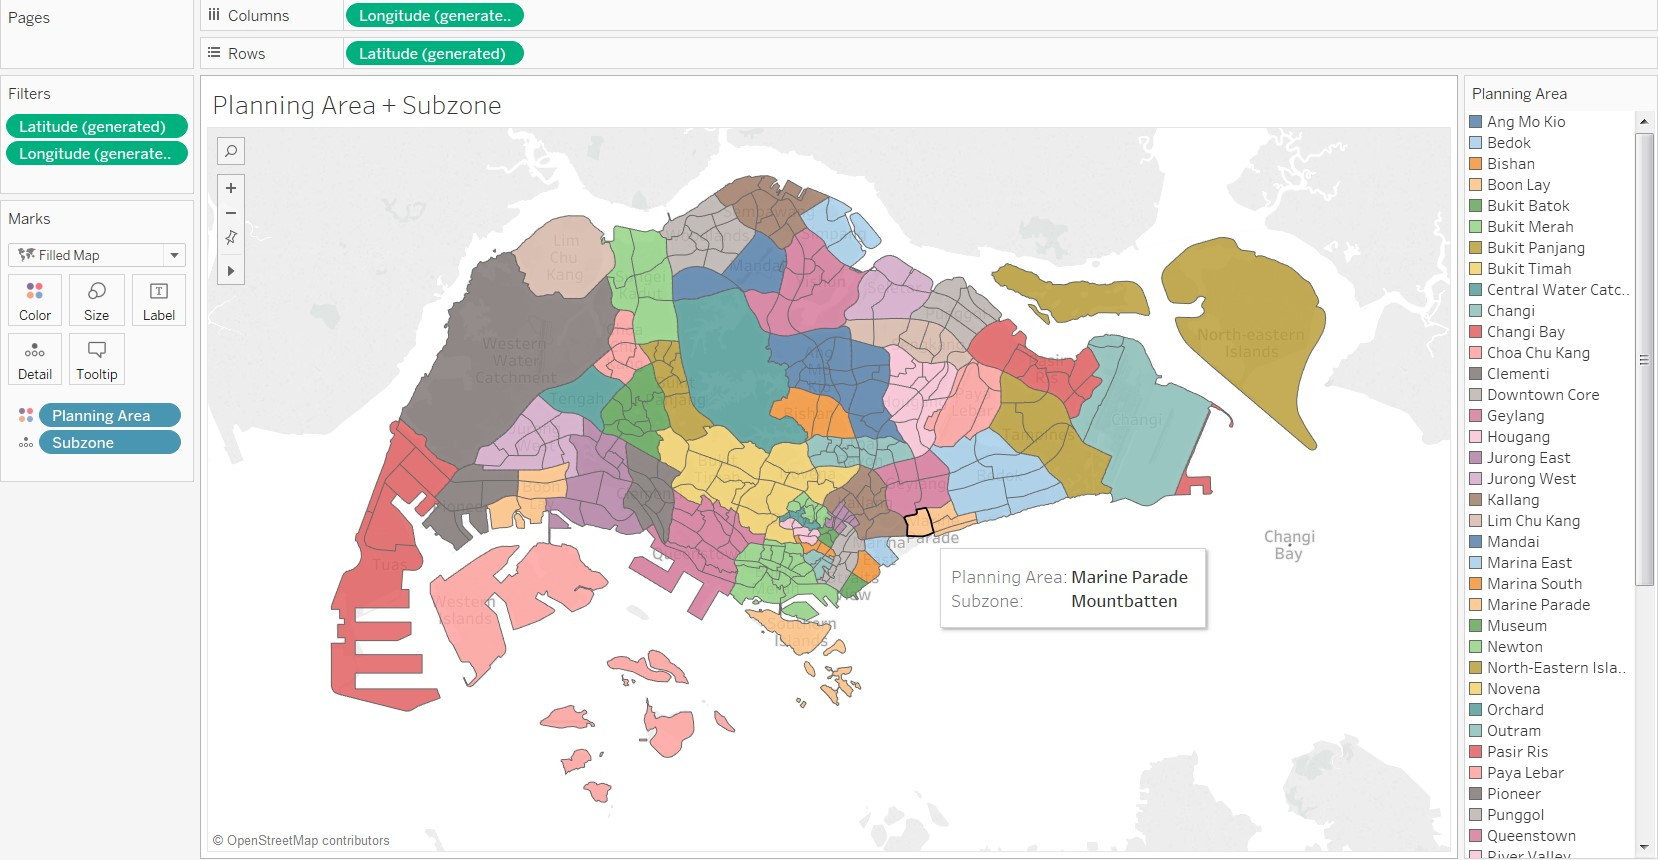
Improvements to bar charts, maps data, geographic roles and radial distance units seem simple, but make data storytelling more natural. Using Singapore as an example, Tableau 10 has included Singapore planning areas, sub-zones (based on URA data) and postal code data so that we can now visualize our data on a Singapore map, down to postal code level.
Do you think the target audience is going to change or widen with v10?
TC Gan: Tableau 10 features what the community has been looking for, and the following is only going to grow now that possibilities are endless.
We currently have more than 46,000 customers worldwide and a community of more than 75,000 passionate members. Over 30 of the features in Tableau 10 were actually suggested and voted on by the community in our Community Ideas Forum. Some specific features include the ability to filter across data sources, get notified on extract failures, and to subscribe others to a workbook.